Every demand-side platform shows a dashboard full of numbers. Impressions, clicks, spend, conversions, and a dozen abbreviations sitting next to each other in a table. For a new DSP owner or media buyer, it is easy to glance at the totals, see that spend is under budget, and move on without asking what the numbers actually mean.
That gap is expensive. A campaign can hit its impression goal and still lose money, because win rate is high on cheap, low-value inventory. A bid strategy can look aggressive on paper while bid rate stays low because the DSP is not reaching enough auctions. Without knowing which metric explains which problem, teams end up guessing at fixes instead of making them.
This guide breaks down the reporting metrics that matter most inside a DSP: win rate, bid rate, CPM, CPA, and ROAS. It explains what each one measures, how they connect to each other along the bidding funnel, and how DSP owners use them to diagnose problems instead of just watching totals go up or down.
Why DSP Reporting Metrics Matter More Than Totals
Total spend and total conversions tell you what happened. Reporting metrics tell you why it happened. A demand-side platform runs thousands of auctions per second, and each one is a small decision: bid or skip, bid high or low, buy this impression or wait for a better one. Metrics are the only way to see the pattern behind those decisions at scale.
This matters even more for agencies and media buyers who own their own DSP rather than buying media through someone else’s platform. Platform owners see the full reporting stack, from raw bid request logs to campaign-level summaries, and that access is what turns a reporting dashboard into an optimization tool instead of a monthly recap.
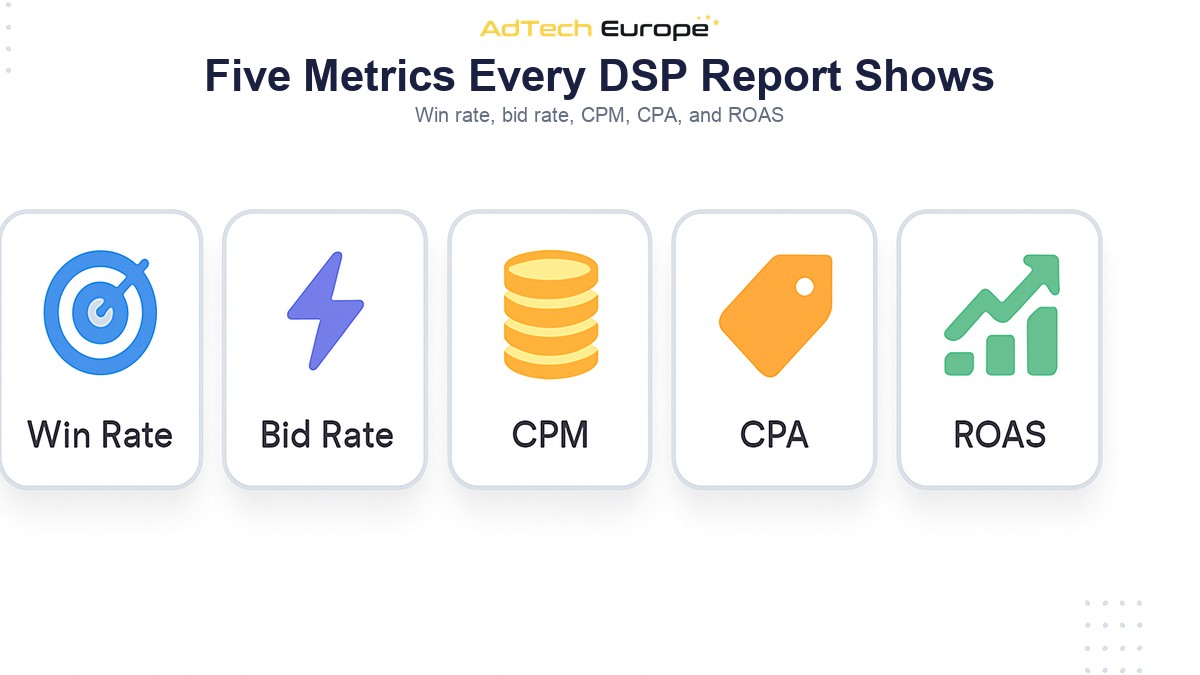
The five metrics below are not the only numbers in a DSP report, but they are the ones that explain the bidding funnel from auction to outcome, and they are the ones worth checking before every other metric.
Win Rate: How Often Your Bids Actually Buy Impressions
Win rate is the percentage of bid requests where your DSP submitted a bid and won the auction. If a DSP receives 1,000 bid requests, bids on 400 of them, and wins 100, the win rate against requests is 10%, and the win rate against bids submitted is 25%. Both versions appear in reporting, so it is worth checking which one a dashboard is showing.
A low win rate is not automatically bad. It can mean the DSP is being selective, only bidding on inventory that matches audience and brand-safety rules, and only winning when the price is right. A win rate near 100% is often a warning sign: it usually means bids are priced too high relative to the market, which drains budget on inventory that could have been bought cheaper.
Win rate is most useful compared over time and across supply sources. A sudden drop can point to a lost SSP connection or a pricing floor change upstream. A sudden spike can mean a bidding rule got too aggressive after an algorithm update.
Bid Rate: How Much of the Available Inventory You Even Consider
Bid rate is the percentage of bid requests a DSP responds to with an actual bid, out of all requests it receives. This is different from win rate. Win rate asks “of the auctions I entered, how many did I win?” Bid rate asks “of the auctions I saw, how many did I enter at all?”
A low bid rate usually means targeting rules, frequency caps, or brand-safety filters are removing most inventory before pricing even happens. That is often intentional. A DSP built for precise media buying should bid on a small, well-matched slice of total traffic rather than everything that arrives.
The risk with bid rate is on the infrastructure side, not the strategy side. If bid rate collapses because the DSP cannot process requests fast enough at high queries-per-second, that is a platform limitation, not a targeting decision, and it caps campaign scale no matter how good the strategy is underneath it.
CPM: What You Actually Pay for Each Thousand Impressions
CPM, cost per mille, is the price paid for one thousand impressions. It is the most familiar metric in programmatic advertising, and also the easiest to misread in isolation. A campaign with a low CPM can still be expensive per conversion if the traffic behind that CPM does not convert.
CPM is most useful as a supply-quality signal rather than a performance signal. Comparing CPM across supply sources, formats, and device types shows where a DSP is finding cheap volume and where it is paying a premium for placement. Sudden CPM changes on the same supply source, without a targeting change, are worth investigating; they often trace back to a change in the auction itself, such as a shift from first-price to second-price bidding on an SSP.
CPA: The Metric That Connects Spend to Outcomes
Cost per acquisition, or cost per action, divides total spend by the number of conversions a campaign generates. Unlike CPM, CPA already includes a judgment about what counts as a result: a purchase, a signed-up lead, an app install, whatever the advertiser defines as the goal event.
CPA is a lagging metric. It reflects decisions made earlier in the funnel: which audiences were targeted, which inventory was bought, how bids were priced. When CPA rises, the fix rarely lives inside the CPA number itself. It lives in win rate, bid rate, or CPM further upstream. A DSP strategy that ties targeting, bidding, and measurement together is what keeps CPA stable instead of reacting to it after the fact.
ROAS: Turning Ad Spend Into a Revenue Number
Return on ad spend, ROAS, divides revenue generated by ad spend, usually expressed as a ratio or a percentage. A ROAS of 4x means four dollars of revenue for every dollar spent. ROAS is the metric most advertisers ultimately care about, because it converts every other metric into a business outcome.
ROAS depends on accurate revenue tracking, which means conversion pixels, server-side tracking, or an integrated attribution feed all need to be set up correctly before the number can be trusted. A DSP report showing strong ROAS on incomplete tracking is not a good result, it is a blind spot. This is one reason platform owners tend to invest more in first-party measurement setup than media buyers renting seat access on someone else’s DSP.
| Metric | What It Measures | What a Problem Usually Means |
| Win Rate | Share of entered auctions won | Too high: overpaying. Too low: pricing or supply issue |
| Bid Rate | Share of seen requests bid on | Too low: filters too tight or QPS capacity limits |
| CPM | Price per thousand impressions | Rising with no targeting change: auction dynamics shifted |
| CPA | Spend per conversion | Rising: check win rate, CPM, and targeting upstream |
| ROAS | Revenue per unit of spend | Weak or inflated: verify tracking before trusting the number |
Reading the Metrics Together: A Simple Diagnostic Order
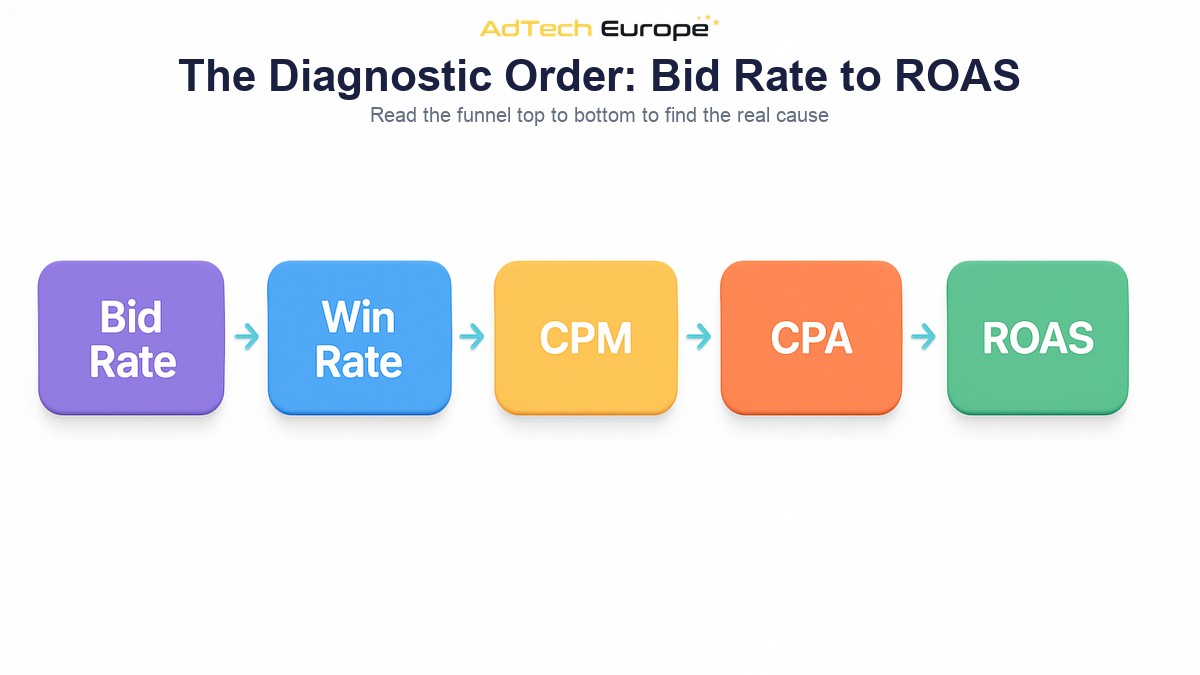
These five metrics are not independent. They sit along the same funnel, from auction to revenue, and the most useful reporting habit is checking them in order rather than jumping straight to ROAS.
- Start with bid rate. If it is unexpectedly low, the problem is in filters or platform capacity, before pricing is even a factor.
- Check win rate next. If it moved sharply, look at bid pricing and supply-side auction changes.
- Look at CPM across supply sources to see if cost per impression is drifting on the same inventory.
- Only then review CPA and ROAS, since both inherit whatever happened in the three steps above.
Working through the funnel in this order turns a vague complaint like “performance is down” into a specific, fixable cause.
Why Reporting Access Depends on Who Owns the DSP
Not every buyer sees the same depth of reporting. Agencies buying media through a managed-service DSP seat often get campaign-level summaries: total spend, total conversions, blended CPA. That is enough to report to a client, but not enough to diagnose why a number moved.
Teams that operate their own platform typically get access to the full reporting stack: win rate and bid rate by supply source, CPM broken out by exchange and format, and raw log-level data that can be exported into a separate BI tool. Reviewing the core features to check before choosing a DSP is worth doing early, since reporting depth is one of the features that is hardest to add after a platform is already in production.
Common Reporting Mistakes to Avoid
A few habits cause more confusion than the metrics themselves.
- Comparing CPM across campaigns with different targeting, formats, or devices as if it were a single like-for-like number.
- Reacting to a CPA change without first checking win rate and bid rate for the same period.
- Trusting ROAS before confirming the conversion tracking behind it is complete and deduplicated.
- Averaging win rate across very different supply sources instead of segmenting it, which hides the sources actually causing a problem.
None of these mistakes require new tooling to fix. They require reading the metrics in the order the funnel actually runs, rather than starting at the bottom line and working backward.
Ready to See These Metrics on Your Own Platform?
AdTech Europe gives agencies, ad networks, and media-buying teams a demand-side platform with full reporting access down to the supply-source level, unlimited QPS so bid rate is never capped by infrastructure, and more than 1,000 SSP integrations already connected. Plans range from a white-label monthly rental to a full licensed or acquired platform, so the level of ownership can match the level of reporting control a team actually needs.
To see the reporting dashboard and discuss which ownership model fits, schedule a programmatic strategy meeting with the AdTech Europe team.
FAQs
What is a good win rate for a DSP?
There is no universal target. A healthy win rate depends on how selective the targeting is; a tightly filtered campaign with a 15-20% win rate can be performing better than a broad campaign winning 80% of its auctions on low-value inventory.
What is the difference between bid rate and win rate?
Bid rate measures how many bid requests the DSP responds to out of all requests received. Win rate measures how many of those submitted bids actually win the auction. Bid rate happens before pricing; win rate happens after it.
Why did my CPA go up even though CPM went down?
Cheaper impressions do not always convert at the same rate as more expensive ones. A falling CPM combined with a rising CPA usually points to lower-quality supply or a targeting change that traded traffic quality for volume.
Is ROAS or CPA the more important metric?
They answer different questions. CPA measures efficiency per conversion; ROAS measures overall revenue return. An advertiser selling low-margin products may focus on CPA, while one selling high-margin or subscription products usually prioritizes ROAS.
Can I see win rate and bid rate broken down by SSP?
On most DSPs, yes, though the depth of that breakdown depends on the platform tier. Fully owned or licensed DSPs typically expose per-source reporting; managed-service seats may only show blended totals.
How often should DSP reporting metrics be reviewed?
Bid rate and win rate are worth checking daily during active campaigns, since supply-side issues show up there first. CPM, CPA, and ROAS are usually reviewed on a weekly cadence, since conversion data needs time to accumulate before trends are reliable.
Do these metrics apply the same way to CTV and in-app inventory?
The definitions stay the same, but typical ranges differ. CTV inventory generally carries a higher CPM with lower volume, while in-app inventory often shows higher bid rates and win rates due to larger available supply.